"There are two classes of forecasters. Those who don’t know and those who don’t know they don’t know."
“Stocks are high, they look high, but they're not as high as they look.”
During the eight months that elapsed since I wrote that blog, Nifty rocketed upwards and on
That’s a rise of 47% in eight months.
The obvious question that I am being asked now is: “What do you feel now about where the Indian stock market is headed?”
Still believing that I belong to the former class of Galbraith’s forecasters, my answer is: I don’t know.
Not knowing what lies ahead does not have to result in paralysis, however. So let me go out on a limb and give my views on the current state of the Indian stock market, and their implications for investment policy.
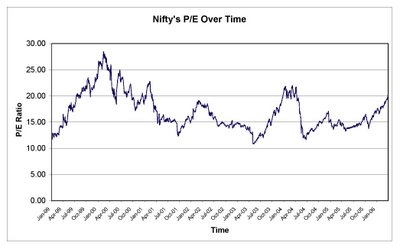
The chart below traces Nifty’s P/E multiple over time. On 
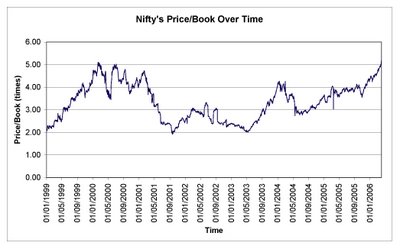
Here is another chart which portrays an even bleaker picture (for bulls). This one traces Nifty’s Price-to-book value ratio over time.
On
A simple look at the P/B ratio chart can easily lead one to conclude that Indian stock market levels are expensive, in comparison to the past. However, one must also see how well corporate

The table clearly shows that the rise in the P/B value is justified because corporate
The future, in other words, is uncertain.
Given this uncertainty, what is one to do? Here are some preliminary conclusions about investment policy going forward:
- Invest in companies that are significantly cheaper than the Nifty stocks.
- Identify stocks which are much more expensive than Nifty – for shorting. This will be necessary and desirable to protect the long positions in deep-value shares in the event of a market decline.
- Don’t leverage for straight equity investing (this was ok when markets collapsed in May 2004 – they have risen by 150% since then) but doing so in special situations is ok provided market risk is minimal.
- Allocate more capital towards special situations – probably 50% and keep the rest in deep-value shares.
